Humanity in the Time of Coronavirus

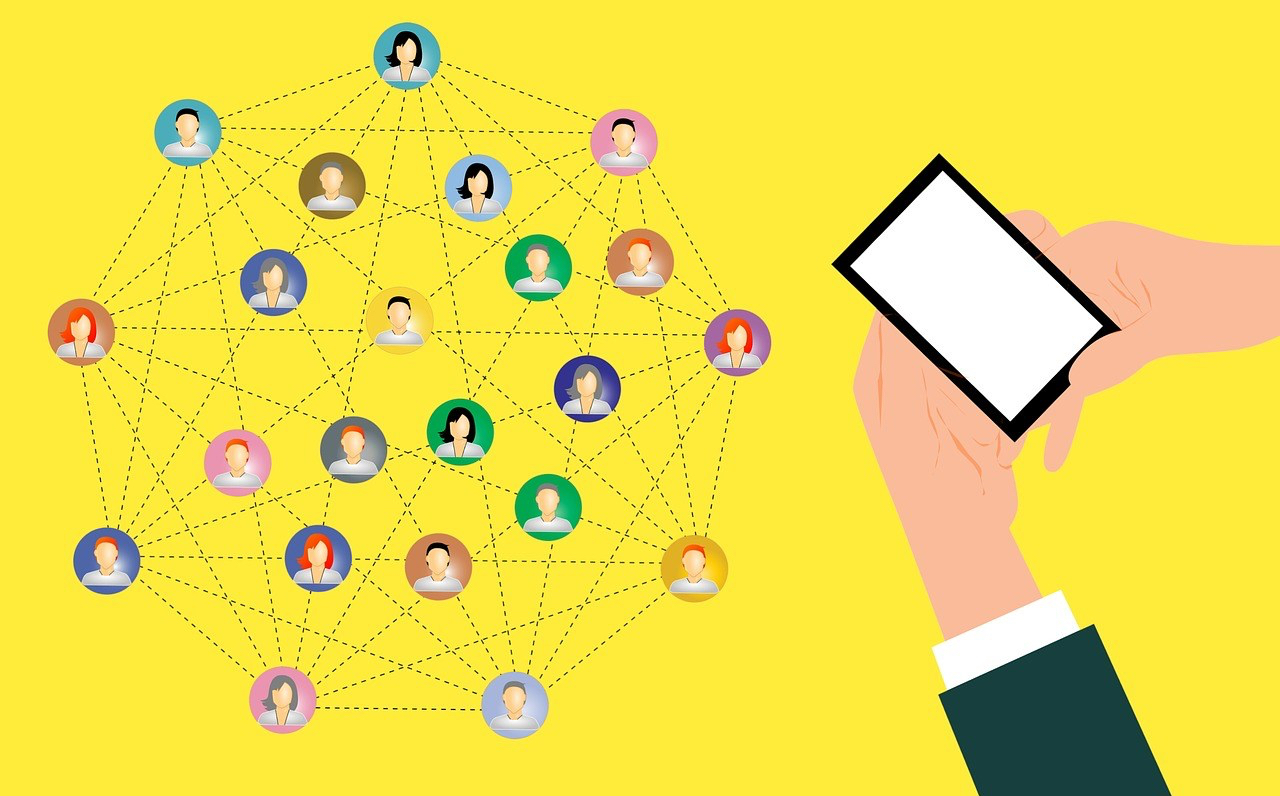
For this final DIY assignment, I chose the topic of community and participatory culture proffered by algorithms and platforms. With this topic in mind, I wanted to create a short video which focused on the coronavirus pandemic. More specifically, I wanted to reflect on how our increased use of social media during this period of quarantine and home isolation is creating a stronger sense and appreciation of global community.

In light of physical distancing, it seems that many people have turned to video sharing platforms such as YouTube, Instagram, TikTok, etc. to seek out human connection. Since coming home from college back in early March to quarantine with my family, I’ve seen an increasing number of these types of videos come across my social media timelines. Day after day, I watched these videos and kept coming back to the same question: How is it that physical distancing has brought people closer together? What do these videos have in common? 

After conducting research for this project, I eventually found that this growing sense of global community could be boiled down to an appreciation of these shared values: music, comedy, self-sacrifice and relationships; and that is how I approached this project. 

With this in mind, I wanted my video to start off with clips from news coverage about the terror of the coronavirus. I then intentionally had the video transition into clips from various social media sites grouped into roughly the aforementioned categories. I essentially wanted the narrative arc of my video to follow this statement: 

The world is experiencing a great deal of death and uncertainty with the spread of the coronavirus. And yet, from sharing music, reminding ourselves to laugh, celebrating frontline workers, and getting closer with family, friends, neighbors and loved ones, we’ve never been closer together. 

Source links 

Quarantined residents in Spain take to their balconies for group exercise

Beautiful Moment Italian Couple Dance to Fred Astaire’s Cheek to Cheek

Ciara : Doctors and Nurses of Tjuh_pool do the LevelUp Dance

Firefighters and first responders line up to thank hospital staff

Coronavirus: Germans sing Bella Ciao from rooftops in solidarity with Italy

Lizzo performs “A Change Is Gonna Come” | One World: Together At Home

The Rolling Stones perform “You Can’t Always Get What You Want” | | One World: Together At Home

Tom Hanks At-Home Monologue – SNL

The Mcfarlands Blinding Light – The Weeknd

Guy Uses Drone To Date During Quarantine

Some Good News with John Krasinski Ep. 1

We clap because we care: New Yorkers applaud coronavirus frontline workers

Experts Warn Of Difficult Week Ahead In Coronavirus Battle | TODAY

1st case of coronavirus confirmed in US l ABC News

NBC Nightly News Broadcast (Full) – April 8th, 2020 | NBC Nightly News

Live: NY Gov. Andrew Cuomo Holds Coronavirus Briefing | NBC News

Coronavirus deaths in US top 3,000#PlayOn: Colorado Symphony’s Digital Ode to Joy

Social Media Surveillance

For this blog assignment, I decided to look at my data files from Facebook, Google and Instagram. In the end I settled on analyzing only the Instagram data files because Facebook didn’t get back to me in time and my Google data wasn’t nearly as interesting as that from my Instagram.

I’m not going to go into detail about every single piece of data Instagram has on me. However, I will say that I was most surprised by how far back they tracked my comment history. I joined Instagram on January 2, 2012 (when I was a mere 12-year-old, which seems like eons ago) and the app has pretty much kept track of almost every comment I’ve made in those 8+ years. Now, I’m not a very active user of Instagram. I maybe post about 6 photos a year, use the Instagram Story feature sparingly and occasionally post a birthday wish or congratulatory comment here and there. Prior to looking at this file, I assumed that my 8+ year comment history would look exactly like this. I was surprised to learn that I was wrong. 

While most of my comment history in the last 5 years has fallen into those categories, I was surprised to see the kinds of comments I was making during my early Instagram days. Scrolling back to the earliest data, it seems that sixth grade me was pretty into commenting on Hunger Games fan pages (cue groan). I like to think that I have a very good memory, but looking through the history I was shocked (and quite frankly a little embarrassed) that I didn’t remember making any of these comments.

Looking past my cringy middle school fangirl phase, the fact that Instagram has all of this data on hand is a pretty big deal. We all signed user agreements before using Instagram for the first time, but the majority of us (myself included) did not read the fine print; and somewhere within that tangled contract full of legal jargon, we gave Instagram permission to track and store our data from the app. So, the question is this: As a society, are there questions that we need to address to account for this massive store of data? I believe that there are. 

First and foremost, these media companies need to have a more open and honest relationship with their consumers about data history; and the first step is making user agreements more user friendly. In the same vein, we as consumers need to work on our digital literacy so that we aren’t at a complete disadvantage. The second has to do with the way that we, as a society, use social media platforms like Instagram. In the digital age, there’s a strange balance between our desire for free expression and for privacy. But with these platforms, the former often comes at the expense of the latter. With the ability to access these personal data files, I would hope that people stop and consider ways they can alter their behavior to maintain their privacy in future.

Media Consumption in the Time of Coronavirus

Hello there! Here’s another media consumption blog post coming your way. For this blog, I was asked to look at the Screen Time app on my phone to track how much time I spend on my device each day. Prior to this, I’d glanced at the Screen Time widget on my phone here and there but was never really surprised by the results. But boy was I in for a shock today. According to the app, I’ve been spending around 6 hours a day on my phone lately; this is 80% more than previous weeks. 

This was very shocking to me, but not completely unexpected. Why? The answer is pretty simple: COVID-19. Since most of us began social distancing a little over two weeks ago, we’ve had a lot of free time on our hands. And most of this is filled with mindless scrolling through social media or obsessively checking news outlets every hour for updates on the coronavirus. According to the Screen Time app, I’ve spent an average of 3 hours a day on social media apps this week, with Instagram accounting for half of that time. The other half is a mix of apps that I don’t spend that much time on individually to make special note of (for example, I only spend about 6 minutes a day on Snapchat). 

As annoying as the amount of time I’m spending on my phone is, it has helped me de-stress quite a bit. With all the uncertainty floating around, it’s nice to take a break and see how people are finding fun ways to cope with social distancing and home isolation. For example, I’ve seen some pretty choice memes and TikToks on Instagram this week. My absolute favorite from this past weekend was a meme comparing the world’s reaction to coronavirus to “The Office” fire drill episode. I was just about rolling on the floor while watching this. 

This specific meme stood out to me because it closely resembles the kind of political satire you’d see on late night shows. In the meme, America is personified as Michael Scott (exhibiting a very delayed reaction to the emergency) and the World Health Organization is Dwight (which gave conflicting information and guidance during the pandemic’s earliest stages). Overall, I liked it because it provided much needed comedic relief from the global health crisis we’re facing. 

In terms of news consumption, it’s unfortunately been a bit light this week. In a normal week, I get my news by going directly to the outlets’ websites, briefly scrolling through Twitter and sometimes through Instagram. But in the last two weeks, I’ve been getting most of my news from watching TV; specifically CNN because it’s constantly on in my house. 

But one piece of news that stood out to me this week was a CNN broadcast story from this morning about the state of hospitals in New York City. What stood out most was that hospitals in the city are starting to use refrigerated trucks as overflow morgues for COVID-19 victims. The footage that they shot from outside the trucks was terrifying and really drove home how devastating the virus truly is. 

Overall, I’d say I’m a bit disappointed with my news consumption at the moment. But I have to admit that it is difficult to be a voracious consumer of news right now without spiraling. And even though as a journalism student I should be better about this, I want to prioritize my mental health during this time and not spend significant time each day devoted to a depressive, deep-news dive. But I do enjoy the time that I’ve been spending on social media. During the quarantine, it’s been heartwarming to see people’s messages of solidarity and to see slogans like “Alone Together” really take off. So while my news engagement may be down, I feel more connected with the communities I’m a part of on social media.  

Alaska is Losing its Sea Ice to Rising Global Temperatures

For this assignment, I created an infographic about Alaska’s disappearing sea ice. I began my research for the infographic assignment by using the provided data set from “Mashable.” However, the data wasn’t very striking or useful, so I looked at a variety of other sources. These included scientific journals, federal and state government websites, and news outlets, to name a few. I eventually found a handful of data points that I liked from three websites:

The Independent  

Data point:

“On average, September sea ice has declined by more than 13 percent per decade over the past 40 years since satellite records began. This is a decline of around 85,000 square km per year — equivalent to losing an area of sea ice each year greater than the size of Scotland.”

The National Parks Service

Data point:

“Sea ice is an important element of the Arctic system because it (1) acts as a barrier between the underlying ocean and the atmosphere, (2) limits the amount of absorbed solar energy during the summer due to its high albedo, (3) provides a habitat for biological activity, (4) limits human access to the Arctic Ocean, and (5) serves as a platform for Indigenous community hunting and travel.” 

Inside Climate News 

Data point:

“Alaska just recorded its warmest July—and warmest month … At a time when the Lower 48 states were clocking average temperatures 1°F above normal, Alaska’s temperatures were 5.4°F above average and 0.8°F more than the previous warmest month, which was July 2004.” 

I chose these data points because out of all the data sets I looked at, these were the most visually compelling points to share. Not to mention, the numbers in the first and third data points are quite alarming and immediately stand out. 

Catherine Orihuela | Annenberg

Color 

When designing my infographic, I first picked out my color scheme. I wanted my colors to reflect the main point of my infographic. Alaska is losing its sea ice to global warming and I wanted to point out 1) the alarming degree to which it has disappeared and 2) why it is so important to the Arctic ecosystem. So, I chose white and light blue to reflect the color of sea ice. And I used the navy blue and gold to reflect the colors of Alaska’s state flag. The blue is also fitting for the deep hues of the Arctic Ocean. 

Layout and graphics 

I wanted my layout to be somewhat chronological. By this I mean that my infographic first presents the problem of sea ice melting and then ends with reasons why sea ice is important. At the top, I created a graphic of sea ice receding from Alaska. Lines lead from the first data point below the title to the gap between the ice and Alaska where I put an image of Scotland (roughly to scale). In the middle, I illustrated my second point by using two thermometers. I placed the temperature increases inside the thermometers and made the traditional red color of the mercury light blue to keep things uniform. In the bottom third of the infographic I illustrated my final data point as a numerical list with small explanatory symbols beside them. 

Through my selection of visually compelling data points as well as consideration of color, layout and imagery, I hope that my infographic illustrates the sobering reality of sea ice melt off the coast of Alaska.

A ‘Study’ in Indifference: Where Culture and the Climate Crisis Clash

“Case Study House no. 22, Los Angeles,” Julius Shulman (1960) | Photo from Time

The image that I chose to manipulate for my DIY #1 assignment was “Case Study House no. 22, Los Angeles” by photographer Julius Shulman. Taken in 1960, the photograph is of the famous Stahl House in the Hollywood Hills. Created by Pierre Koenig, the home is a textbook example of modernist, industrial architecture of the day. To help make this new style of home-building more appealing to Los Angeles residents, Shulman was brought in to shoot a photography series as part of a real estate marketing scheme. In this photo, two women are seated in an all-glass living room high above the city. Such picture-perfect staging was intended to sell California — specifically Hollywood — as a so-called “Promised Land” for people to flock to during the 1960s. 

Photo from the National Resources Defense Council, Inc.

In my manipulated image, I’ve carefully removed the background and replaced it with an image of a 2015 forest fire in Washington state. I selected this image because it shares similar left-leading lines with the Stahl House photo.

Catherine Orihuela | Annenberg

In making this change, my new image is meant to serve as a commentary on natural disasters (many of which are caused by climate change) and people’s long-term response to them. People affected by forest and brush fires (especially those residing in Southern California) are very aware of the threat that these fires pose. But after the initial outbreak of the blaze, within a few weeks or sometimes even a few days, many just return to their normal routine. I wanted to play on this idea of normalcy and blissful ignorance in relation to natural disasters by using an image from the 1960s — a time when keeping up appearances and cultural uniformity were highly valued in postwar America. So, while a forest fire blazes just outside this multimillion-dollar home, its residents appear unbothered by the destruction and carry on with their chat. 

“SMELL”-ing NFL Coverage with John H. McManus

This past Sunday (the first Sunday in February) was the most holy of days for football fans around the nation — Super Bowl Sunday. But for me it was just another Sunday. I got up early, spent most of the day at work and then threw myself into homework once I got back home. 

I’ve never been much of a football fan and I don’t plan on changing that any time soon; even if I do happen to attend a university that idolizes the sport and its players like the Olympians of old. It just seems so overrated to me. But while I may not care for it, there are many who view football as a way of life.

Take Mike and Kyle Shanahan for instance. The two would have been the “first father-son head-coaching duo” to coach 49ers Super Bowl wins; but alas it wasn’t meant to be as the Chiefs beat out the San Francisco team for the win this year. 

Photo courtesy of Wikipedia

But before the loss, an article was published by the NFL talking about the history-making duo. While not focused on a big news story, it’s still worth running through SMELL as it appears to be largely appealing to the reader’s emotions more than anything else. In terms of sources, the author used very few. A quote from 49ers quarterback Jimmy Garoppolo is included (most likely as a means of entertaining and persuading the reader to think favorably of the Shanahans) and there is a brief mention of an NFL research study (although curiously the link to said research is not provided in the article). 

The Jimmy Garoppolo quote is not surprising. As quarterback, Garoppolo is around coach Kyle Shanahan a lot and will therefore have high proximity and expertise as a source. However, this means that his independence is quite low, and he may have contributed the quote to cast a more favorable view on the 49ers as a team. However, I am surprised that the writer didn’t include a link to the aforementioned NFL research. The purpose for the NFL research was to inform readers. Had the writer linked it, the sources credibility would’ve been much higher. 

Overall, it seems that this article isn’t the most credible. In addition to the lackluster sources, the writer uses language and imagery such as “tender moment between father and son” and “overflowing with memorable moments.” All these suggest that the writer may not be as independent of his subject as he should be. 

Post-First Week of Class is the Perfect Time for a Media Reflection

To christen this new blog, I’m starting off with a post about media consumption. This Sunday I recorded my technology use for 24 hours. Disclaimer to my readers: this 24-hour period was a bit unusual. For the past two weekends, I’ve been participating in Panhellenic Recruitment and Sunday was the final round of activities —Bid Day— so I was disconnected for extended periods. Regardless, I believe the data is a fairly accurate (albeit imperfect) snapshot of my media habits. To make this easier to understand, I’ve divided my post into three categories: news, social and entertainment media habits. 

Me (right) with one of my sorority sisters, Lydia, (left) outside Alpha Gamma Delta house on Bid Day this past Sunday.

News media consumption 

If I’m being perfectly honest, I didn’t consume a lot of news on Sunday. I spent an hour listening to NPR’s Weekend Edition after breakfast but ended up tuning it out because I was returning work emails. When looking for daily news, I check news alerts, the Los Angeles Times, the New York Times and CNN. For long-form stories I listen to NPR, flip through the New Yorker or peruse outdoor magazine newsletters (Outside magazine is a favorite of mine). 

Photo from NPR
Photo from Outside Magazine

But like I said, I consumed less news on Sunday than I normally do. Besides tuning out NPR, I didn’t check the LA Times or New Yorker newsletters in my inbox and didn’t visit any of my favorite online magazines. 

Social media consumption 

Like most young people, I have a lot of exposure to social media. But according to the handy-dandy Screen Time feature on my iPhone I spend only 50 minutes daily on social platforms. Don’t get me wrong, I have my fair share of hours-long, zombie-like scrolling sessions as much as the next Gen-Z or Millennial, but the numbers are pretty accurate. I mostly use Instagram to check posts from friends, public figures and organizations I find interesting. Beyond that, I don’t have a huge social media presence. I rarely share photos (last year I posted a grand total of 9), comment or share links. 

I spent 2 hours on social media Sunday. Like most days, I checked Instagram in the morning but was unusually more active in the evening, sending and accepting friend requests to and from my sorority sisters. 

Entertainment media habits 

I spent the most time on entertainment platforms yesterday at about 4 hours. This seemed pretty accurate. On most nights, I listen to Spotify or watch something on one of the streaming services. Sunday, I spent 2 hours listening to 70s Rock Anthems on Spotify, was introduced to South Park by my sorority sisters and started Season 2 of You with my roommate. 

Photo from Spotify

Concluding Thoughts 

All in all, I’m seriously lacking in news consumption. I have the access but need to make better use of it going forward. If I’m to become more informed as a student, aspiring journalist, American and global citizen I should actively incorporate the news into my daily life. 

There are good and bad habits in life. Having a good relationship with the news is one worth pursuing.

Design a site like this with WordPress.com
Get started